
The Art of Program Visibility: Managing Databricks + Azure Data Programs at Scale
The Invisible Failure
Most data platform programs don't fail loudly. They fail quietly — one missed dependency, one unreported pipeline issue, one status update that said 'green' while the underlying data quality was red.
After two decades in IT delivery and six-plus years building data platforms on Azure Databricks, I have seen a consistent pattern: technical execution is rarely the bottleneck. Visibility is.
The Technical Program Manager (TPM) on a Databricks or Azure data platform program is not just a project tracker. The TPM is the connective tissue between engineering reality and business expectation. And the primary tool of that role is structured, layered visibility.
This article is a practitioner's guide to building that visibility layer — from pipeline health to steering committee reporting — drawn from real delivery experience on medallion architecture rollouts, Unity Catalog migrations, and large-scale ADF-based ingestion programs.
The Visibility Stack: Four Layers That Matter
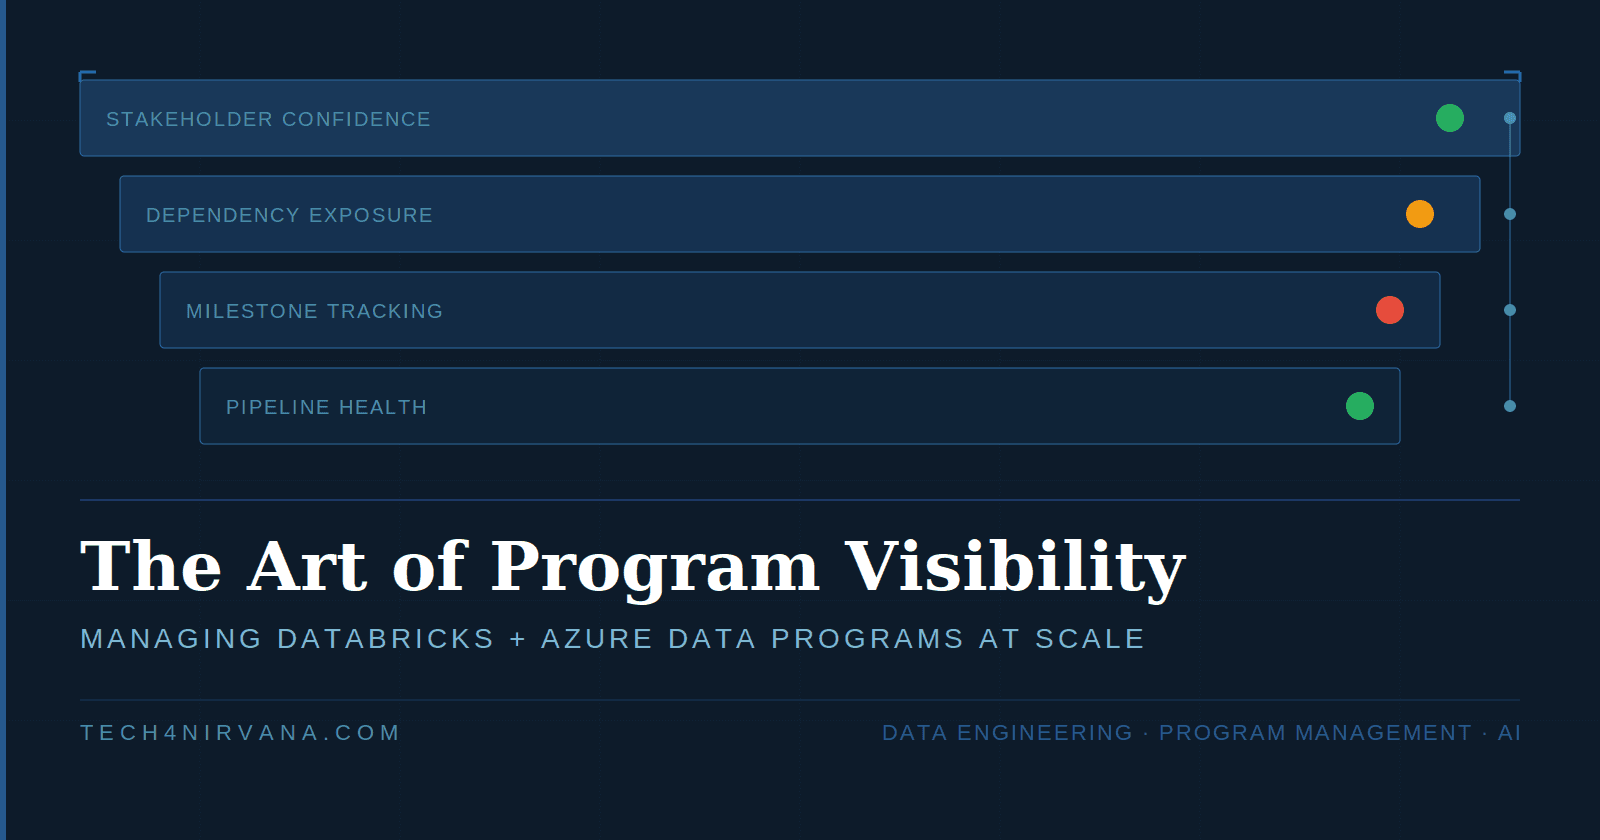
Effective program visibility is not a single dashboard. It is a stack of four interconnected layers, each serving a different audience and time horizon.
| Layer | What It Tracks | Primary Audience | Cadence |
|---|---|---|---|
| Pipeline Health | Job runs, failures, SLAs | Engineering Team | Real-time / Daily |
| Milestone Tracking | Sprint vs. program progress | TPM + Tech Leads | Weekly |
| Dependency Exposure | Cross-team, cross-system risks | TPM + Architects | Weekly |
| Stakeholder Confidence | RAG status, trend, business impact | Leadership / Sponsors | Monthly |
Each layer feeds the one above it. A pipeline failure at Layer 1 becomes a milestone risk at Layer 2, a dependency flag at Layer 3, and — if unresolved — a red RAG item at Layer 4. The TPM's job is to manage the signal flow across all four layers simultaneously.
Layer 1: Pipeline Health Monitoring
Databricks Job Monitoring
In a production Databricks environment, job health is the ground truth of program status. The key instrumentation points are:
- Job run success/failure rates tracked via Databricks Workflows UI or REST API
- Cluster utilization and auto-termination anomalies — unexpected terminations often signal memory pressure or misconfigured autoscaling
- Lakeflow Spark Declarative Pipelines event logs — specifically quarantine metrics and data quality expectation failures
- Structured Streaming lag metrics for near-real-time pipelines — consumer lag is a leading indicator of downstream SLA breach
As a TPM, you do not need to debug these yourself. You need to ensure your engineering team has a monitoring contract — agreed thresholds, owners, and escalation triggers — before the pipeline goes to production. The absence of a monitoring contract is itself a program risk.
ADF Run Status
Azure Data Factory pipelines are typically the ingestion layer in a medallion architecture. Key monitoring practices:
- Use ADF Monitor with alert rules on pipeline failure — do not rely on manual checks
- Track watermark drift: if the high-watermark timestamp in your control table is not advancing, data freshness is silently degrading
- Distinguish transient failures (network timeouts, throttling) from structural failures (schema drift, source unavailability) — they have different resolution paths and different stakeholder implications
TPM Principle: A pipeline failure that surfaces in a steering committee meeting before it surfaces in your monitoring layer is a program governance failure, not a technical one.
Layer 2: Milestone Tracking for Data Platform Migrations
Medallion Architecture Rollout as Milestone Anchors
A medallion architecture migration — Bronze → Silver → Gold — provides a natural milestone structure that is legible to both engineers and business stakeholders. The key is to define exit criteria for each layer transition, not just completion dates.
| Layer | Engineering Exit Criteria | Business Exit Criteria |
|---|---|---|
| Bronze | Raw ingestion pipelines stable; schema registry in place; data retention policy applied | Source system onboarding complete; data freshness SLA agreed |
| Silver | Deduplication and cleansing logic validated; DQ expectations passing >99.5%; Unity Catalog lineage active | Business glossary terms mapped; data steward sign-off obtained |
| Gold | Aggregation logic reviewed by business; Databricks SQL queries validated; performance SLA met | UAT complete; business owner sign-off; production cutover approved |
This dual-criteria approach prevents the most common milestone failure in data programs: engineering marking a phase complete while business stakeholders have not validated the output.
Unity Catalog Migration Milestones
Unity Catalog migrations carry specific governance complexity. Structure milestones around these control points:
- Metastore provisioning and account-level admin alignment — often blocked by IT governance, not engineering
- Workspace attachment and existing cluster migration — plan for a deprecation window, not a hard cutover
- Data Access Control migration — moving from legacy table ACLs to Unity Catalog privileges requires a privilege audit first. The audit should enumerate all existing GRANT statements at the database, table, and view level; map them to Unity Catalog securable objects (catalog → schema → table); and identify orphaned permissions with no active principal. Budget at least one sprint for this exercise on programs with more than 20 tables and multiple team-level access groups. Skipping it results in either over-permissioned production catalogs or broken access after cutover — both are compliance incidents in regulated environments.
- External location and storage credential setup — validate with the cloud infrastructure team before scheduling migration windows
- Lineage and audit log enablement — confirm with compliance that the System Catalog meets audit requirements
Governance note: Unity Catalog migrations in regulated environments (BFSI, Healthcare) must align metastore boundaries with data residency requirements. This is a TPM dependency item, not an engineering decision.
Layer 3: Dependency Exposure
In large data platform programs, dependencies are the primary source of schedule risk — not technical complexity. The TPM's job is to make dependencies visible before they become blockers.
Dependency Mapping Framework
Categorize dependencies across three dimensions:
| Type | Examples | Mitigation Approach |
|---|---|---|
| Internal (cross-team) | Data platform team waiting on API team for source schema; ML team waiting on feature store from DE team | Weekly dependency sync; shared JIRA epic with cross-team tickets |
| External (third-party) | Source system vendor delivering data extract; cloud infra team provisioning ADLS containers | Formal SLA agreement; escalation path documented in RAID log |
| Governance / Compliance | Data classification sign-off; PCI-DSS scoping for Gold layer; HIPAA BAA for healthcare data | Involve compliance stakeholder in milestone review cadence from Sprint 1 |
Dependency Visibility in the Sprint
In programs involving multiple delivery teams, dependency risk compounds when teams are optimizing for different sprint goals. The TPM must ensure that cross-team dependency work is explicitly ticketed and assigned in the sprint — not just logged in a dependency register. An integration task that exists only in a RAID log has no owner and no deadline. Make it a sprint ticket, or it will not get done.
Layer 4: Stakeholder Reporting Cadences
Two Reports, Two Languages
Leadership does not read engineering dashboards. Engineers do not need executive summaries. The TPM authors two distinct artifacts:
- Weekly Engineering Pulse: pipeline metrics, sprint velocity, open blockers, dependency status — shared in the team channel or stand-up
- Monthly Steering Committee One-Pager: RAG status, milestone trend (on track / at risk / delayed), top 3 risks with mitigation status, business impact summary — presented to sponsors
RAG Status Template for Data Platform Programs
| Milestone / Workstream | RAG | Trend | Key Update |
|---|---|---|---|
| Bronze Layer Ingestion | 🟢 Green | → Stable | All 12 source pipelines running. Watermarks current. |
| Silver Transformation | 🟡 Amber | ↑ Improving | DQ exceptions in Claims feed resolved. Revalidation in progress. |
| Unity Catalog Migration | 🔴 Red | ↓ Delayed | IT governance sign-off delayed by 2 weeks. Revised date: [X]. |
| Gold Layer / Reporting | ⚪ Not Started | — | Pending Silver sign-off. Planned start: Sprint 8. |
| Cloud Spend / FinOps | 🟡 Amber | ↑ Improving | DBU consumption 18% over forecast in Sprint 6. Cluster policy applied. Tracking weekly. |
Three rules for RAG status credibility: never go from green to red in one reporting cycle without a prior amber; always include a trend arrow alongside the RAG colour; and always pair a red status with a documented mitigation action and revised date. The Cloud Spend row is not optional — leadership in cloud-native programs increasingly treats DBU consumption vs. value delivered as a primary health signal, not a finance footnote.
Risk Escalation for Pipeline Failures
Classifying Pipeline Failures
Not all pipeline failures are equal. The TPM must help engineering leads apply consistent classification to avoid both under-escalation (hiding problems) and over-escalation (noise fatigue in leadership).
| Severity | Definition | Examples | Escalation Path |
|---|---|---|---|
| P1 – Critical | Business process blocked; SLA breached; data loss risk | Gold layer job failure before EOD report; CDC pipeline stopped for >4 hrs | Immediate: TPM → Delivery Manager → Business Owner |
| P2 – High | Degraded processing; SLA at risk; workaround available | Silver DQ failure affecting 1 of 5 feeds; ADF retry loop consuming capacity | Same day: TPM flags in engineering sync; updated in weekly pulse |
| P3 – Medium | Non-critical path issue; no immediate business impact | Bronze schema drift in secondary source; cluster startup latency increase | Next sprint: tracked in backlog; reviewed in weekly engineering sync |
| P4 – Low | Cosmetic or logging issue; no functional impact | Notebook warning messages; deprecated API usage flagged in logs | Backlog: addressed in maintenance sprint |
Escalation discipline note: A P1 that the TPM learns about from a business stakeholder — rather than from the engineering team — indicates a broken escalation contract. Establish the escalation chain in program kickoff, not after the first incident.
The RAID Log for Databricks + Azure Programs
A RAID log (Risks, Assumptions, Issues, Dependencies) is the TPM's primary program governance artifact. For data platform programs, the standard RAID template needs calibration to capture data engineering-specific risks accurately.
Common RAID Items in Databricks / Azure Programs
| Type | Item | Description | Mitigation / Resolution |
|---|---|---|---|
| Risk | Unity Catalog metastore region lock-in | Once metastore is provisioned in a region, cross-region data sharing requires additional configuration | Confirm data residency requirements with compliance before provisioning |
| Risk | DBU cost overrun | Serverless and all-purpose clusters have different DBU rates; misconfigured job clusters can 3–5x expected costs | Implement cluster policies and cost alerts in Week 1; review weekly |
| Risk | Schema drift from upstream | Source systems may change schema without notification, breaking Bronze ingestion silently | Enable schema evolution in Delta; add DQ expectations at Bronze ingestion |
| Assumption | Source system API availability | Source team will maintain API uptime during migration window | Confirm SLA in writing; document in RAID; test in lower environment first |
| Issue | Spark Structured Streaming lag | Consumer lag observed on Claims topic during peak hours; Silver SLA at risk | Scale streaming cluster; increase trigger interval; escalated to P2 |
| Dependency | IT Infra: ADLS container provisioning | Gold layer cannot be built until IT provisions production ADLS Gen2 containers with correct RBAC | Owner: [IT Lead]. Due: [Date]. Escalation path: [Name] |
The RAID log is a living document. Review it in every weekly engineering sync. An item that has not been updated in two weeks is either resolved (and should be closed) or forgotten (and is now a hidden risk).
The TPM as Connective Tissue
A data platform program is a complex system. Databricks clusters, ADF pipelines, Delta Lake tables, Unity Catalog policies, business stakeholders, compliance requirements, and delivery teams — all interdependent, all operating at different speeds and speaking different languages.
The TPM does not build the platform. The TPM builds the visibility layer that allows the platform to be built reliably. Without that layer, even the best engineering team will eventually deliver the wrong thing, at the wrong time, with the wrong stakeholders informed.
Program visibility is not administrative overhead. It is a delivery capability — as important as data architecture, and far more often the differentiator between programs that succeed and programs that recover.
If your data platform program is on track and you cannot explain why in three bullet points that a business sponsor would understand, your visibility layer needs work.
Karthik Darbha is a Senior Data Engineering & AI Leader with 23 years of professional experience, including 20+ years building enterprise data platforms across Healthcare, Pharma, Retail, Insurance, and Financial Services. He writes about data engineering, program management, and the intersection of technology and philosophy at tech4nirvana.com.